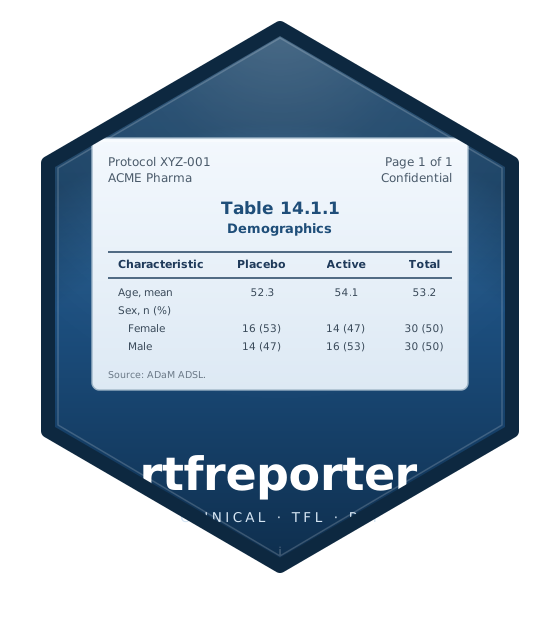
Draws a wireframe of the table: column-header band, data band (with the row count annotated), spanning headers if any, and column widths drawn proportional to the table's effective layout. Borders are sketched at the table's outer frame and at zone boundaries (TFL preset is shown by default).
Usage
# S3 method for class 'rtftable'
plot(x, width = 8, ...)
Arguments
- x
An
rtftable()object.- width
Plot width in inches (the page's writable width is assumed to be 10 inches = landscape letter minus margins). Default
8.- ...
Unused.
Examples
tbl <- rtftable(data.frame(Parameter = "Age", Value = "75.1"), border = "tfl")
if (interactive()) {
  plot(tbl)      # a quick on-screen preview of the table layout
}