

Specifications for clinical tables, listings and figures, as Excel workbooks (and YAML for figures): what is analysed, how it is laid out, how the report is dressed. tflspec turns a spec into the object it stands for and into the R program that makes it; rtfreporter renders the RTF, and tflplanner is the GUI on top.
tflplanner   the GUI; installing it installs the other two
    |
tflspec      specs -> objects and code (needs rtfreporter, cards at run time)
    |
rtfreporter  the RTF renderer; usable on its own
Working with an AI assistant? Attach tflspec_ai_manual() (the manual of the version you have installed) to the chat session.
The examples use the package’s oncology sample study, XYZ-ONC-01 (Drug X vs Control): simulated ADaM datasets adsl, adex, adae, adlb, advs, adrs, adtr and adtte (?adsl), and an example study folder that writes and runs its programs, system.file("examples", "onco", package = "tflspec").
Status: early development (0.0.x). Discussion and sample code: Discussions.
R 4.1 or later; analyses that use cardx (e.g. t-tests, confidence intervals) need R 4.2 or later.
Concept
- A spec becomes readable code. The program tflspec writes from a spec is short and plain, close to what a statistical programmer writes by hand and easy to maintain – a program people can read, copy and finish by hand.
- The typical cases, kept simple. The spec’s columns cover the analyses and table layouts most studies use, so that the code written from them stays simple; they do not try to cover every possible design.
- R code inside the spec. What the columns cannot say is written in the spec as R – a condition, a derived column, an argument, a step after the ARD, or a whole program for a report – and the written program places it where it belongs.
-
Shared setup, per-report values. What all reports share (header, footer, page style, and study information such as the company name, analysis type and protocol ID) is written once as setup code; each report’s program carries only its own values. The company’s font and size are the
pagesheet’s study row (a blankoutput_id), and a report’s own row wins.tfl_report_setup_code()writes that font, the study’s tokens and the running header and footer once, as a setup script (sayreport_setup.R) that every report program written withtfl_report_code(setup = TRUE)sources. Code lists, like analysis data, belong to a report (output_idon everycodelistsrow), so one report’s factor levels and variable labels never reach another’s. - Spec -> code, one way. The spec is the source (written by tflplanner or edited directly) and the program is written from it; the program is not edited in place.
The one workflow
ADaM ──(ARD spec)──> ARD ──(table spec)──> plan ──(report spec)──> RTF
          tfl_ard_code()      tfl_table_code()       tfl_report_code()
          tfl_build_ard()     tfl_table_plan()       tfl_report()
Each spec can be run or written out as a program from the same list of steps, so the object and the program cannot disagree. The written program is what a study keeps: it needs rtfreporter and cards, not tflspec. What a spec makes is checked against the same thing written by hand: the ARD value by value, a table’s RTF byte by byte.
ARD spec
A workbook of four sheets: study (the subject key, where the ARD goes), datasets (the data and its derived columns), populations (the analysis sets) and analyses, one cards / cardx call a row. A population is what ICH E9 and the CDISC Analysis Results Standard call an analysis set: tfl_ars() writes each one as an ARS AnalysisSet, and an analysis’s population_id as its analysisSetId.
| output_id | analysis_id | method | dataset | population_id | by | variables | args |
|---|---|---|---|---|---|---|---|
| T-14-1-1 | AGE | continuous | SAF | TRT01A | AGE | ||
| T-14-3-1 | TEAE | hierarchical | ADAE | SAF | TRT01A | AEBODSYS | AEDECOD | over_variables = TRUE |
| T-14-2-2 | KM | cardx::ard_survival_survfit | ADTTE | ITT | TRT01P | y = “survival::Surv(AVAL, 1 - CNSR)”, times = c(6, 12) |
spec <- tfl_read_ard_spec("spec/ard_spec.xlsx")
cat(tfl_ard_code(spec), sep = "\n")     # the cards / cardx program
ard  <- tfl_build_ard(spec)             # or run it: one study ARD
method is a keyword (tfl_ard_methods()), any pkg::function, or a function of the study’s own (study key source) – for what cards and cardx have no function for. strata and denominator are columns; anything else goes in args, as R.
Table spec
The table’s roles and the rtfreporter plan verbs, one sheet a grain: tables, variables, cells, layout, columns, style, cell_styles, col_header.
spec <- tfl_read_report_spec(c("report.xlsx", "tables.xlsx"), output_id = "DM")
plan <- tfl_table_plan(normalize_ard(tfl_ard_for(ard, "DM")), spec)
tfl_table_code(spec)                     # or the program: table_plan() |> plan_*()
A plan written in code goes back to a workbook with tfl_as_table_spec(), which names what a sheet cannot carry and compares the RTF.
Report spec
The page, the running header and footer, the titles and footnotes, a watermark: sheets report, page, header, footer, titles, footnotes.
doc <- tfl_report(spec, content = plan)
generate_rtfreport(doc, tfl_report_path(spec), overwrite = TRUE)
tfl_report_code(spec, content = "plan")  # or the program
Listing spec
Two sheets keyed by output_id: listings (the dataset, where, sort, rows a page) and listing_cols (one row a printed column).
spec  <- tfl_read_listing_spec("spec/listing_figure_spec.xlsx")
tfl_listing_code(spec, "L-16-2-7", datasets = catalog)   # the program
pages <- tfl_listing(adae, spec, "L-16-2-7")             # or the pages
tfl_as_listing_spec() writes a listing coded with rtfreporter back as a spec.
Figure design
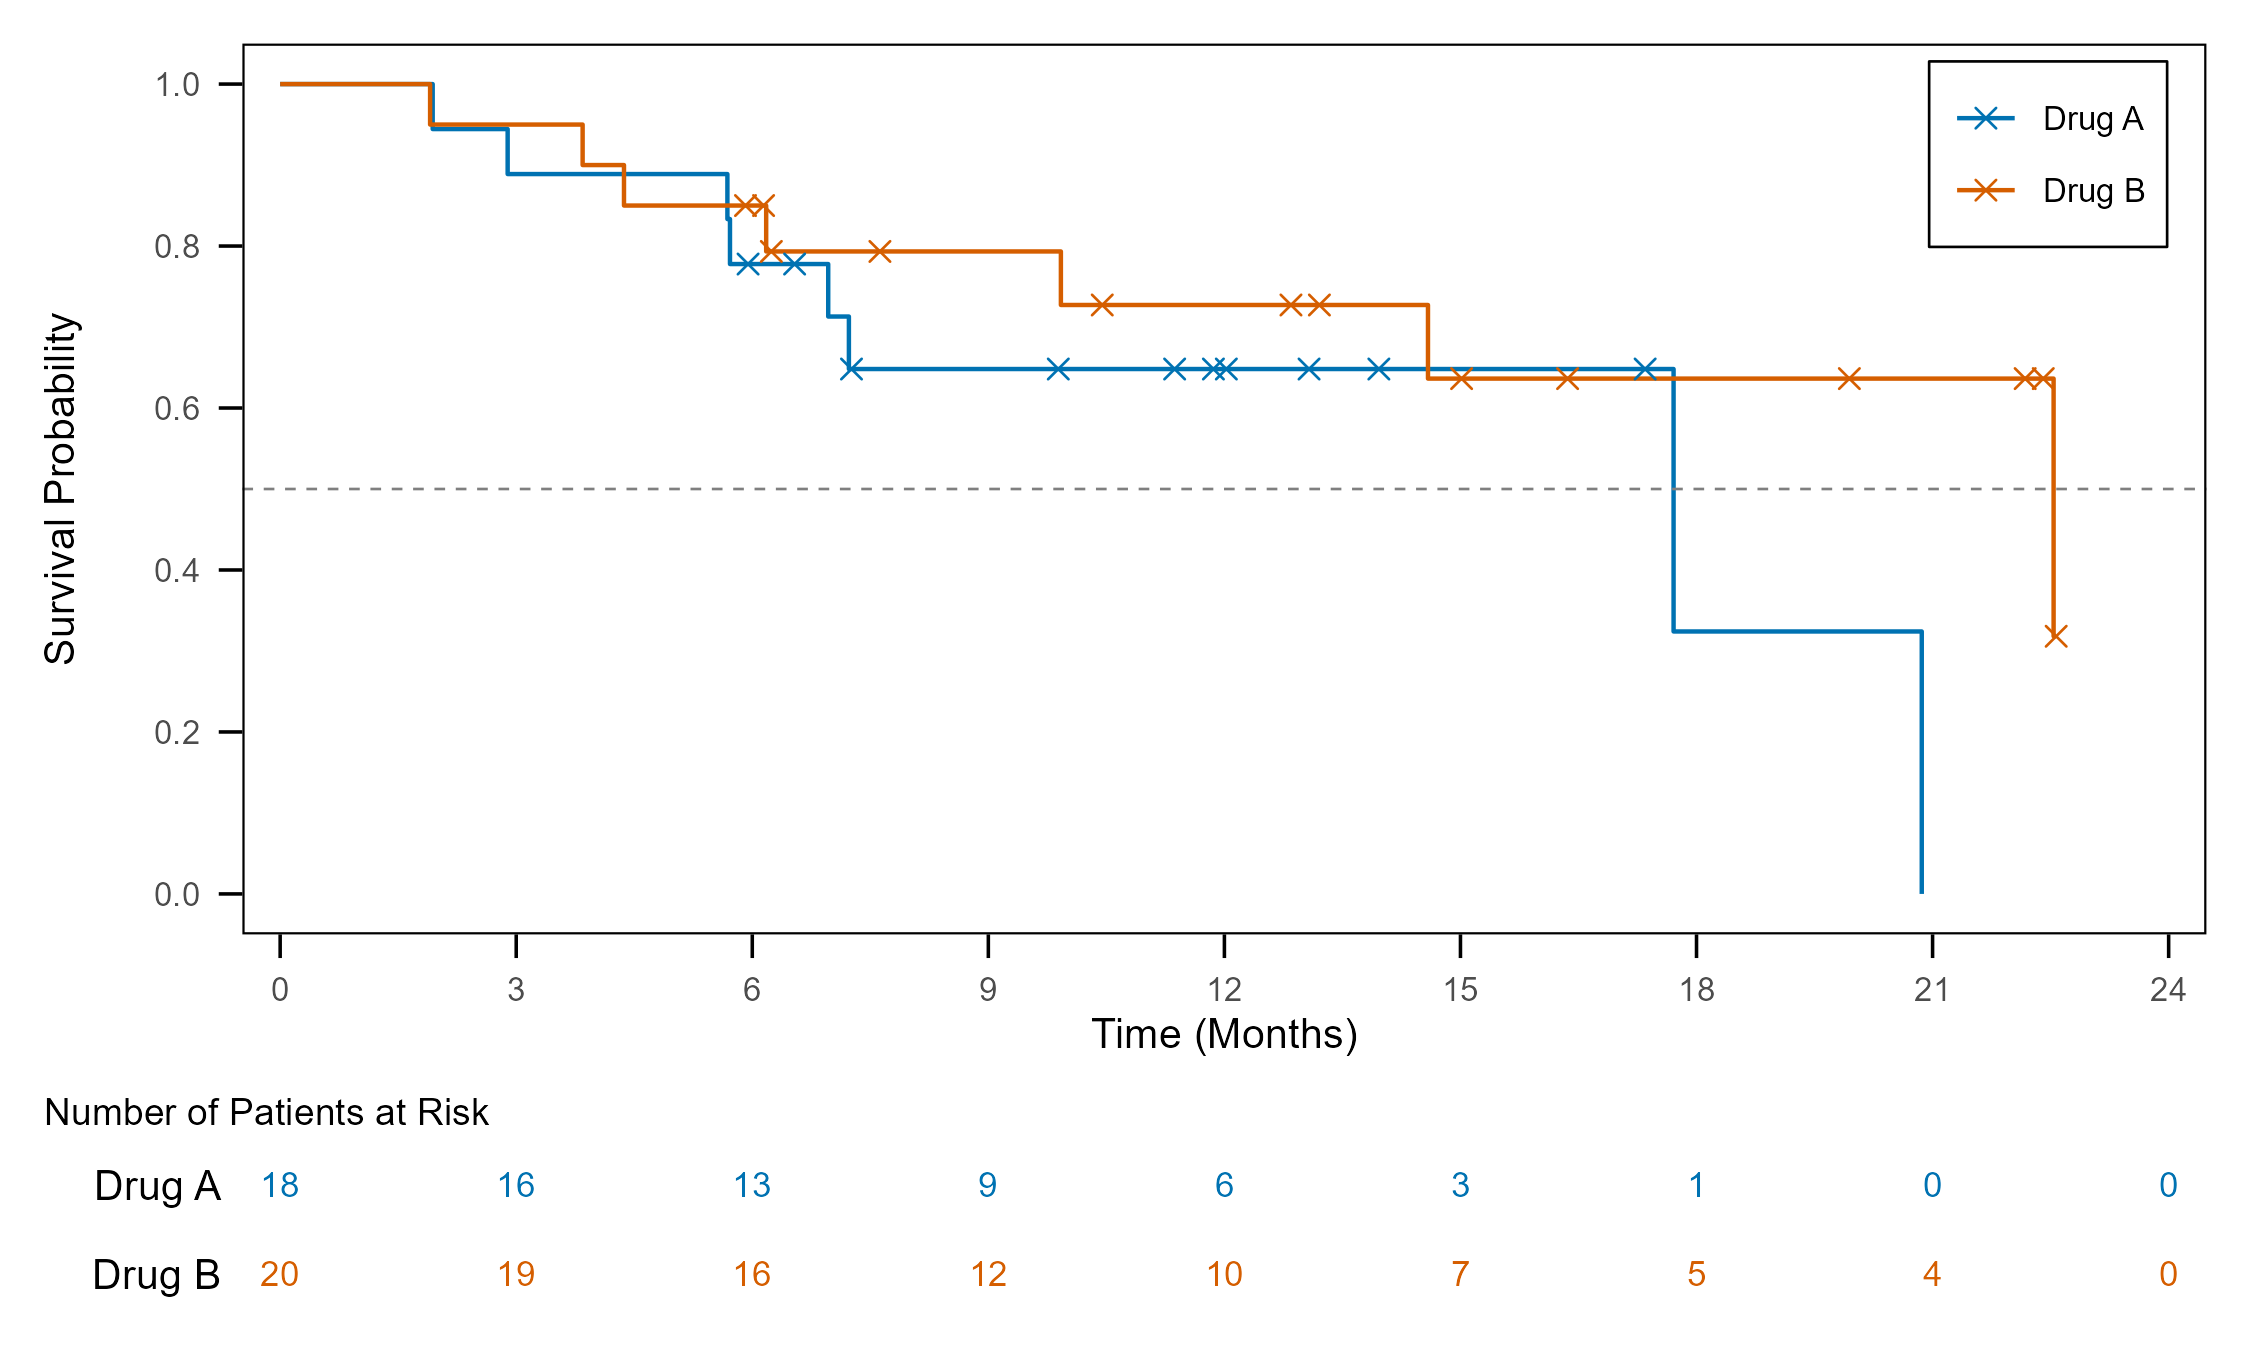
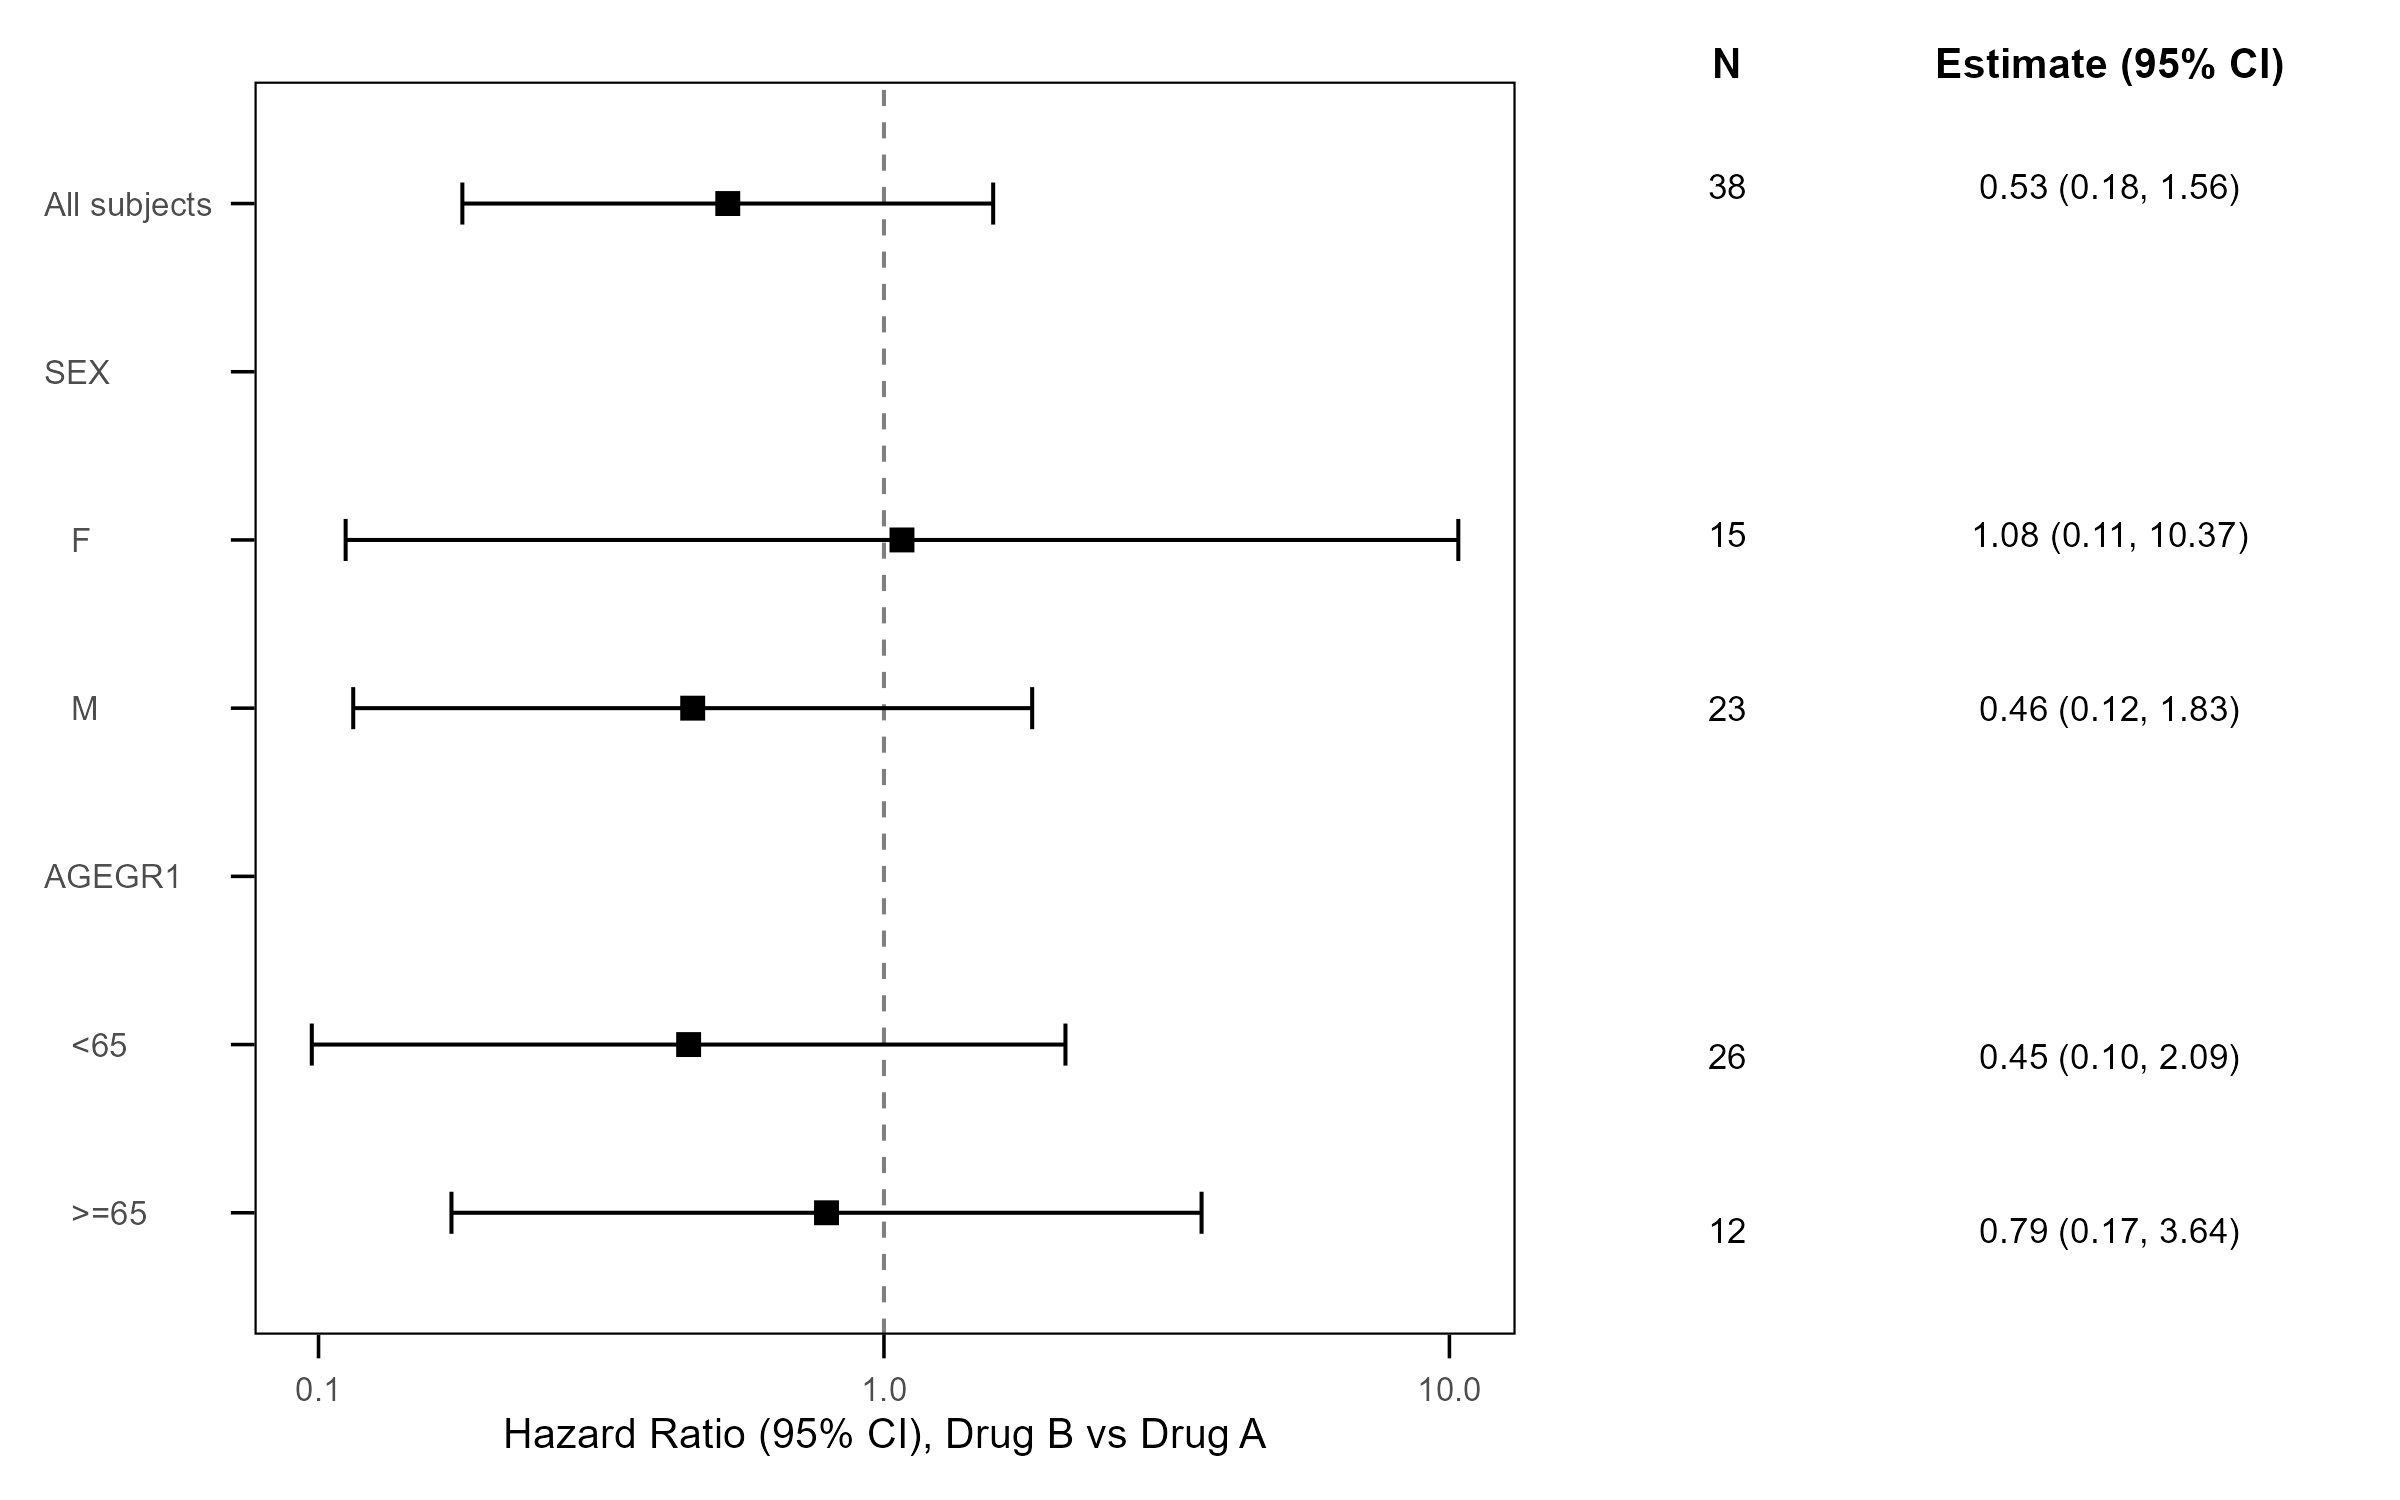
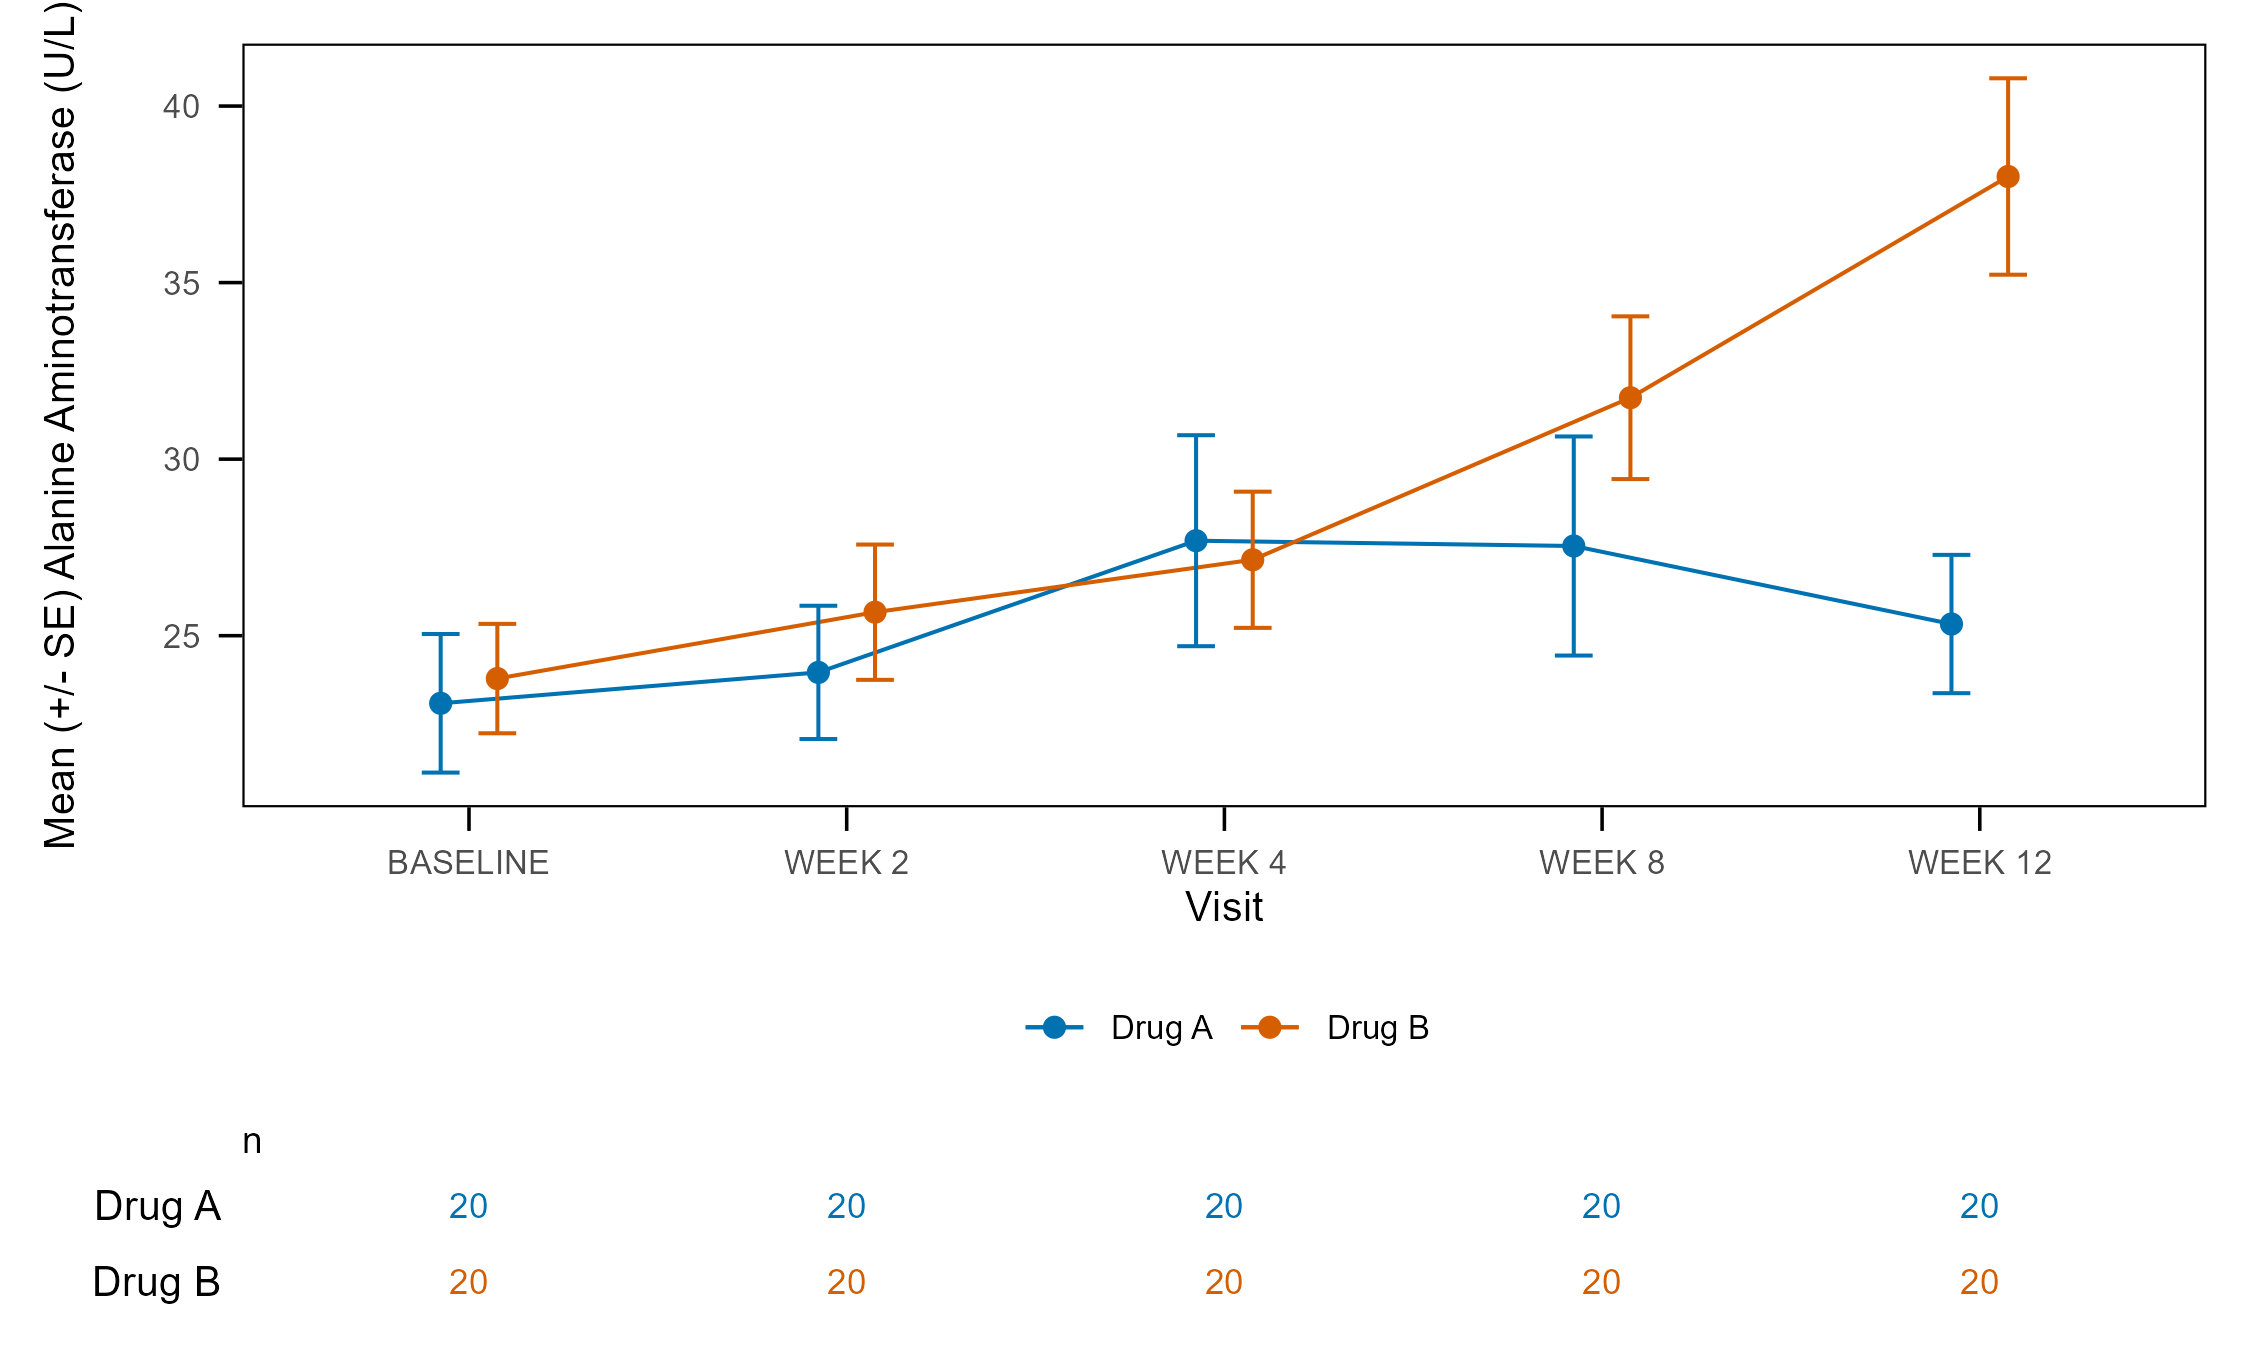
A figure is a YAML design – its data steps, statistics and layers – that tfl_fig_design_code() writes as a ggplot2 script depending only on dplyr and ggplot2 (+ ggsurvfit / patchwork). Start from one of 38 templates:
d <- tfl_fig_template("km_risk_table", param = "OS", group = "TRT01P")
tfl_check_fig_design(d, adam)
cat(tfl_fig_design_code(d), sep = "\n")| KM with the number at risk | forest plot | mean by visit |
|---|---|---|
 |
 |
 |
tfl_fig_style() holds every look-and-feel value of a study’s figures. The older sheet-based figure spec and its quick figures (tfl_fig_km(), tfl_fig_waterfall(), … tfl_fig_catalog()) remain while the development team decides between the two.
CDISC ARS
The ARD spec as CDISC’s Analysis Results Standard, and back:
ars <- tfl_ars(ard_spec, table_spec, report_spec)
tfl_write_ars_json(ars, "ars.json"); tfl_check_ars(ars)
tfl_ars_to_specs(tfl_read_ars_json("theirs.json"))   # anyone's ARS as specs
Column names
Table, listing and report columns are rtfreporter’s argument names (a layout column is the verb’s prefix and its argument: pages_max_rows is plan_paginate_rows(max_rows = )); ARD columns are cards’ (by, variables, strata, denominator), with two exceptions: statistics (cards’ statistic) and formats (tflspec’s own). A column whose value has a unit says it (_twips, _in, _half_points; rel_width is a relative width). One argument is written in one place: a column, or args, never both. Every column is described on its header cell’s comment and by tfl_spec_columns().
Citation
If tflspec helps your work, please cite it with citation("tflspec"). The statistics of the tables come from cards and cardx; please cite those too (citation("cards"), citation("cardx")).
Acknowledgements
tflspec stands on the work of many others, and we are grateful to their authors.
- cards and cardx: the analysis results data (ARD) that every ARD spec is written for, an outcome of the pharmaverse community’s work on analysis results data.
- ggplot2 and its extensions (ggsurvfit, patchwork and others): the figure code tflspec writes is their code.
-
CDISC: the Analysis Results Standard, whose JSON Schema is included unchanged (
inst/ars/, MIT; seeinst/COPYRIGHTS), and siera, which reads ARS.
tflspec is an independent project and is not affiliated with, or endorsed by, the authors of these packages or CDISC.
License
Apache License 2.0 © 2026 Yoichi Masui. See LICENSE.md. The CDISC ARS JSON Schema in inst/ars/ keeps its own MIT licence (see inst/COPYRIGHTS).